Hot stocks analyzed in the report of Vietstock Consulting Department include CTD, CTG, DIG, DPM, FPT, MSN, PSH, SHB, VPI, and VIC.
These stocks are selected according to technical analysis signals, liquidity, investor interest … The analysis below can serve short-term as well as long-term reference purposes.
CTD – Coteccons Construction Joint Stock Company
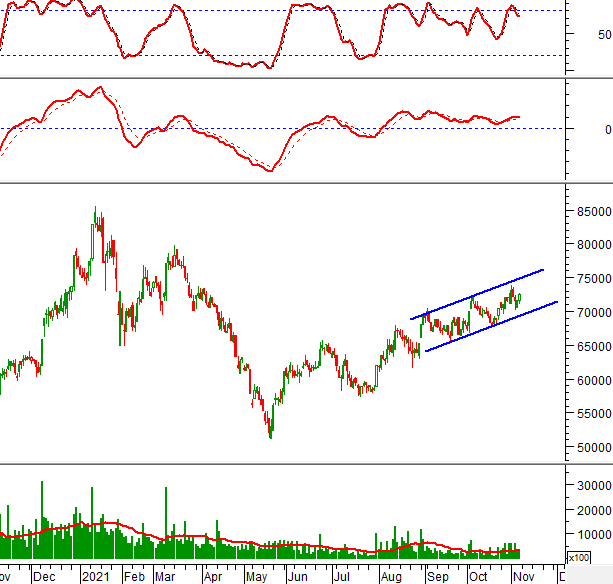
The short-term upward price channel has been maintained for the past several weeks. Analysts expect the lower band of the channel (equivalent to the range of 69,000-70,000) to be strong support for the price in the near future.
The MACD has risen again and is unlikely to cut below the signal line, so the risk of a deep correction is not too great.
The trading volume is above the 20-day average, showing that the market cash flow is pumping strongly into CTD stock.
CTG – Vietnam Joint Stock Commercial Bank for Industry and Trade
In the trading session on November 5, 2021, the price appeared a pattern similar to Dragonfly Doji, showing that the possibility of a breakout is still there.
Bollinger Bands are expanding strongly. The price is clinging to the Upper Band so the short-term outlook is quite positive.
The short-term target is the 34,500-35,500 zone (equivalent to the old peak in August 2021).

DIG – Construction Development Investment Joint Stock Company
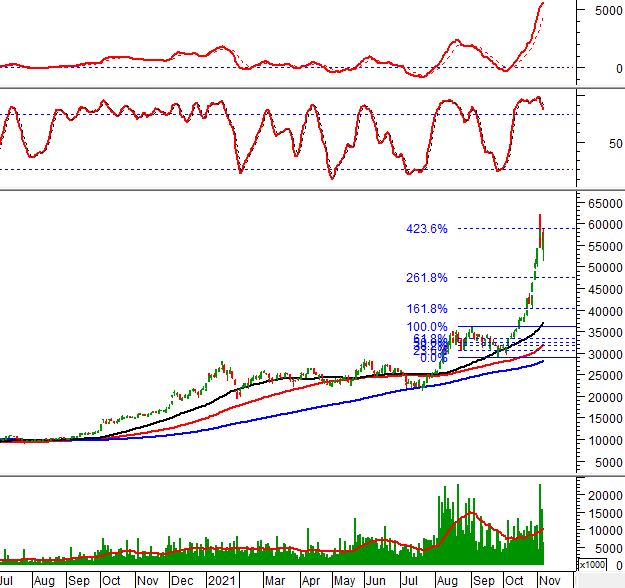
In the trading session on November 5, 2021, a red candle appeared, showing that investors are quite pessimistic in the short term.
DIG's stock price shook and struggled continuously when touching the Fibonacci Retracement level of 423.6% (equivalent to the area of 59,000-60,000). This will be the main resistance in the near term.
However, the 50-day SMA has crossed above the 100-day and 200-day SMA to form golden crosses. Besides, the 100-day SMA and the 200-day SMA also gave similar signals, showing that the long-term uptrend is returning and the risk of a deep drop is not too great.
DPM – Petrochemical and Fertilizer Corporation – JSC
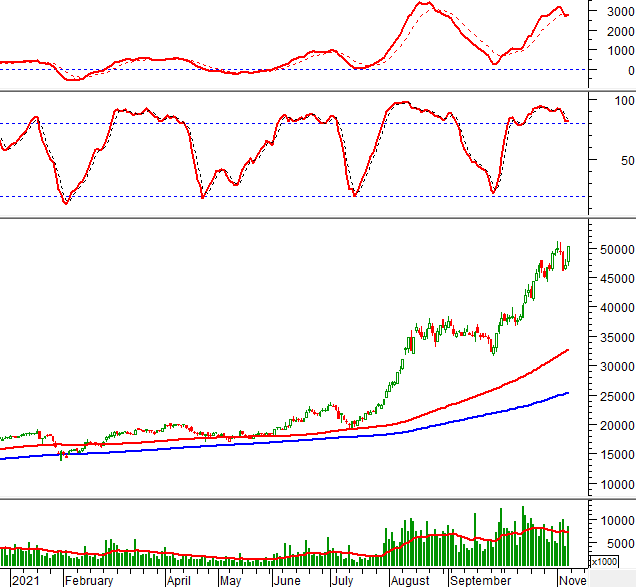
The price continued to the all-time high in the trading session on November 5, 2021. The White Marubozu pattern shows investor optimism.
Currently, the MACD has shown a buying signal again, so the short-term outlook is quite positive.
Trading volume increased sharply and exceeded the 20-day average. This shows that market money is still pumping into DPM.
FPT – FPT Corporation
In the trading session on November 5, 2021, a green candle appeared and the price started growing again after completing the throwback.
The Triangle pattern appeared after the price made a breakout in October 2021. The target price of this pattern is up to the 104,000-105,000 zone.
The increasing trading volume and possibly surpassing the 20-day average shows that the cash flow still hasn't left FPT stock.

MSN – Masan Group Joint Stock Company
In the trading session on November 5, 2021, the Doji pattern appeared, showing that investors are quite confused.
The Relative Strength indicator is below its 20-day moving average, showing that the price is underperforming the market.
Investors are also concerned about prospects when the strong sell signal of the Stochastic Oscillator has appeared.

PSH – Nam Song Hau Petroleum Investment and Trading Joint Stock Company
In the trading session on November 5, 2021, PSH's stock price recovered after having tested the 200-day SMA in the previous session. Currently, the price is challenging at the 38.2% Fibonacci Projection level.
If it breaks above this level, the stock's uptrend will be consolidated. At that time, the next target of PSH will be the adjacent old peak area and the 50% Fibonacci Projection threshold. The MACD is above zero. If this signal is maintained, the risk will not be large.
However, the trading volume dropped below average in the last session of the week, showing that investors are cautious again.

SHB – Saigon – Hanoi Commercial Joint Stock Bank
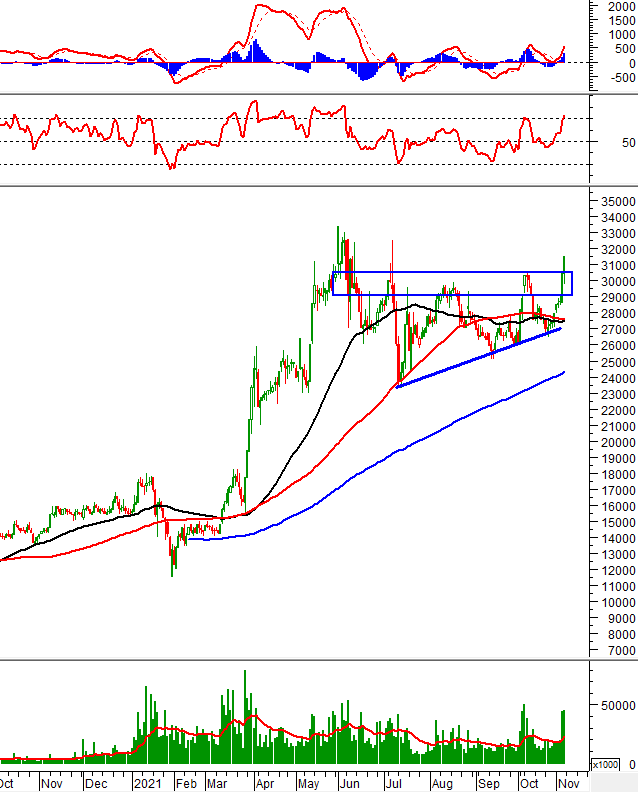
In the trading session on November 5, 2021, SHB's stock price surged past the old peak of October 2021 (equivalent to the range of 29,000-30,500) with the White Closing Marubozu candlestick pattern and the trading volume suddenly increased far from the 20-day average).
According to technical analysis, this zone will become the nearest support if the correction reappears.
The MACD and the Relative Strength Index still maintain positive signals, thereby supporting the possibility of SHB's price increase. The next target will be the old peak in June 2021 (equivalent to the area of 32,000-33,500).
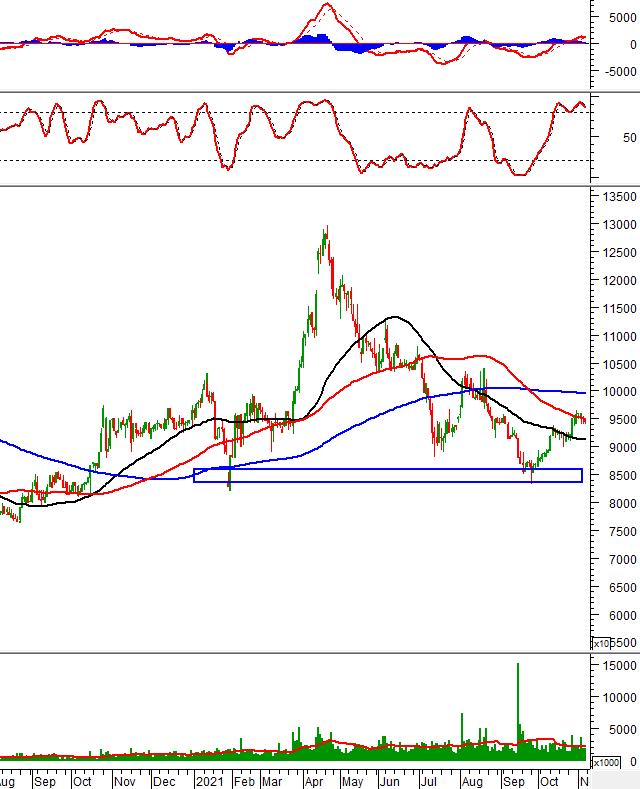
VIC – VINGROUP – JSC
In the trading session on November 5, 2021, VIC's stock price continued to test the 100-day SMA resistance line.
If this resistance is conquered, VIC's uptrend will be consolidated. At that time, the stock will have a chance to test the 200-day SMA.
The Stochastic Oscillator maintains its downward momentum after selling previously. If this indicator falls out of the overbought zone, the risk increases. Then, the 50-day SMA will be the nearest support for the stock.
VPI – Van Phu Investment Joint Stock Company – INVEST
In the trading session on November 5, 2021, VPI's stock price strongly broke out and surpassed the Fibonacci Projection level of 261.8% with the Rising Window candlestick pattern.
Besides, the trading volume continued to increase and remained above the average level of the last 20 sessions, showing that the cash flow of the stock is quite abundant.
The MACD and the Relative Strength Index maintained positive signals, thereby showing that the stock's uptrend is being supported.

Technical Analysis Department, Vietstock Consulting Department
FILI